
This is Tharindu Jayasinghe – the technical lead for the latest release of the Milky Way Project (MWP). In this blog post, I will revisit some of the greatest hits from the history of the MWP and give you a preview of our latest science. If you haven’t done so already, read the first installment of this brand new MWP blog.
The birth of the MWP
The MWP started off as the ninth (yes, we were one of the earliest!) Zooniverse project in December 2010. Inspired by ‘The Bubbling Galactic Disk’, a paper published in 2006 by a group of astronomers who visually inspected the Spitzer Space Telescope survey images in the first hunt for Galactic infrared bubbles, the Milky Way Project was born. The earliest visual inspections of this vast data set were done by just a small number of astronomers, most of whom were undergraduate students like myself. Their efforts culminated in a two bubble catalogs listing roughly 700 bubbles. You might be wondering, “Why do we need the MWP if a few undergraduates can do all this work?” The answer to this question captures the essence of citizen science. Thousands of volunteer “citizen scientists” going through the same dataset will spot most, if not all, the objects visible in this dataset, while a handful of even highly-trained astronomers will miss many objects. Of course, different citizen scientists might disagree on any given classification. Take for example, a bubble seen in the MWP data. I might draw this bubble slightly larger than what you would draw if you were asked to make a classification. Is this problematic? No, not in the least! The consensus of the crowd is what’s critical in citizen science, and, as you will see, different classifications average out very nicely to give us what we need.

The initial launch of the MWP was hugely successful! We drew in over 35,000 volunteers from all over the world. After several months and 520k bubble classifications, the first phase of the MWP ended. The MWP technical lead at the time, Dr. Robert Simpson, wrote code to aggregate all these classifications into one final bubble catalog. This “DR1” catalog of 5,106 bubbles was published along with the first MWP paper. This increased the total number of cataloged bubbles by an order of magnitude. This was an amazing feat and spawned numerous follow-up papers (those by the core MWP are described on our Results page). All was not perfect however. Several problems, including redundancy, were seen in the DR1 catalog. Correcting these problems is critical to meeting our current science goals.
A second dose of the Milky Way Project
Shortly after our DR1 bubble catalog was published, we updated the classification interface, released new image sets (in a new color scheme), and improved upon the classification tools that were available in the first phase of the project. I will now describe the changes that were made in the second phase of the MWP and why they have turned out to be especially important.
So, what changed?
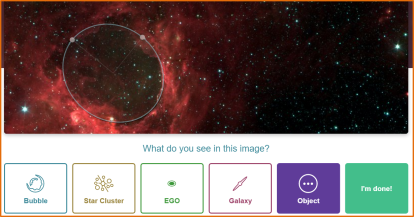
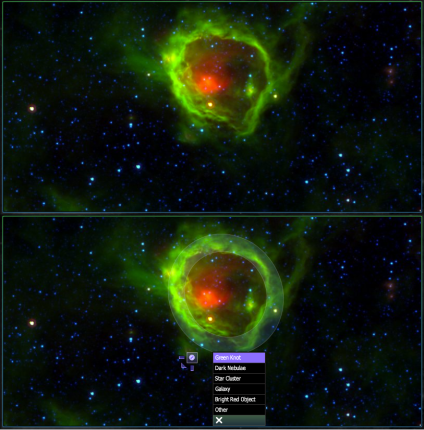
For those of you who have been with us during the first phase, you might have encountered the ‘elliptical annulus’ tool when classifying bubbles. I’ve included a figure to jog your memory. The new ‘ellipse’ tool available in phase 2 was a big change from the annulus tool. The annulus tool was difficult to use: it was by default a circle, changing the inner/outer radii was cumbersome and fitting it to match the shape was harder than it needed to be. By contrast, the ellipse tool makes it easier to draw bubbles and measure sizes and shapes more accurately.
Another drastic change made in phase 2 was the type of images used to make classifications. If you’ve used MWP in the past month, you are familiar with the stunning “green+red” color scheme used in the current images. This was the same color scheme that was used in the first phase of the project. The second phase of the Milky Way Project shifted to a “pink/red” color scheme. Why make this change? Viewing the Galaxy with different combinations of image data (corresponding to our two different color schemes) can help identify structures best seen in only one of the color schemes. Take for example EGOs (Extended Green objects): these were only seen in the “pink/red” color scheme. Another excellent example would be the bow shocks that are easily seen in the “green+red” color scheme but rarely spotted in the other. Moving to the “pink/red” color scheme also meant that images from certain parts of the Milky Way that were not available in the first phase due to a lack of survey coverage at 24 µm could be included. This allowed MWP volunteers to map the more of the Galaxy.
What did I mean by “lack of survey coverage”? To make the images in the “green+red” color scheme, we use data from two different surveys: MIPSGAL and GLIMPSE. The MIPSGAL data are responsible for the lovely hues of red seen in the bow shocks produced by the massive runaway stars and the distinctive color of “yellowballs”. But GLIMPSE (and two companion surveys, Vela-Carina and GLIMPSE-3D) together surveyed more of the Galaxy than MIPSGAL did. This enabled us to produce images in the ”pink/red” color scheme out of this extended data sets.
Our image making algorithm, created by the lead scientist of the MWP, Dr. Matthew Povich, had the capability to produce images at twice the level of zoom than did the previous version. The highest possible zoom level available in the first phase of the MWP was 0.3° x 0.15°. In the second phase, we doubled our maximum zoom level (producing images at 0.15° x 0.075°). This had a few implications. The number of images in MWP phase 2 was four times greater than in phase 1 (but that was OK, because by then we knew our volunteers could handle the increased workload). Smaller structures were more easily seen in the images with the highest zoom level, and this allowed citizen scientists to identify new structures and improve upon the measurement of existing structures previously catalogued by the MWP.
Bringing us back to the discussion about the second phase of the MWP, the project continued, now pink-red, and 3 years later, in 2015 we ran out of data and the MWP came to a hiatus. Dr.Robert Simpson took up a job at Google and my mentor, Dr. Matthew Povich took the helm. As decribed in Dr. Povich’s previous post, after a year-long hiatus the MWP resumed its operations behind the scenes as I joined the team and began development on the current version. Alongside this, I undertook the task of analyzing 3 years’ worth of classifications from the second phase of the Milky Way Project.
Aggregating your classifications from MWP Phase Two
I completely rewrote the MWP classification aggregation pipeline and work began on understanding the 2 million classifications made by MWP volunteers from 2012-2015. We found some pretty amazing results. The ellipse tool significantly changed how volunteers made measurements of bubble sizes. The drawings that were made in phase two were more accurate and representative of the actual shapes of the bubbles (see the comparison figure below). Over 24,000 volunteers helped us during phase two and made over 770,000 bubble classifications. From this data, we were able to obtain roughly 4400 bubble candidates in our “DR2 alpha” catalog. It should be noted however, that we are continuously testing and making modifications to this pipeline in order to avoid the issues that were encountered in the DR1 catalog. You may wonder why this our DR2 catalog contains fewer bubbles (4400) compared to the DR1 catalog (5100). There are two reasons: (1) Bubbles are more easily seen in the “green+red” color scheme (DR1) than in the “pink/red” scheme (DR2), and (2) we have made progress getting rid of the duplicated bubbles found in the DR1 catalog.

The Phoenix rises from its ashes: MWP Phase Three
MWP Phase Two seems to have done its job. “So why do you still need my help?” you might ask. Excellent question! There are three main goals:
- We want to build and publish the first-ever citizen-science enabled bow shock catalog. We did not ask people to identify bow shocks in Phase One, and even if we had, we didn’t have high enough zoom levels in the image. We did ask people to look for bow shocks in Phase Two, but they were difficult or impossible to spot in the pink/red color scheme.
- We need to publish an improved, DR2 bubble catalog. This catalog will be produced through the combined efforts of MWP volunteers in both Phase Two and Phase Three — 4.4 million total classifications. This is very exciting for us! Thanks to the improved ellipse tool, we are now able to obtain better measurements of bubble parameters. By zooming in further, smaller bubbles and structures are better resolved and classified. Essentially, we are combining the strengths of Phase 1 (“green+red” color scheme) and Phase 2 (improved ellipse tool, higher zoom) in one final run through the Spitzer images during Phase 3.
- Finally, with the higher zoom level, green+red color scheme, and a dedicated “yellowball” tool, an improved and more comprehensive yellowball catalog is also in the works.
My fellow MWP enthusiasts, great things await all of us. Keep reading our blog for more updates, and most importantly, keep on classifying! Stay tuned for the next installment of the MWP blog where Don M. Dixon, a science team member, shares some exciting information about the bow shock search in MWP phase 3.
I cannot stress enough as to how we are very thankful to all of you, our amazing volunteers, for all your work in making the MWP a success. We owe it all to your efforts. Thank you for helping us better understand our home Galaxy better.

One thought on “A Brief History of the Milky Way Project: Why We (Still) Need Your Help”